Age of the Universe using linear regression
Introduction
The big-bang model implies that the universe expands uniformly according to Hubble’s law.
Where
Data hubble:
##      Galaxy    y     x
## 1   NGC0300  133  2.00
## 2   NGC0925  664  9.16
## 3  NGC1326A 1794 16.14
## 4   NGC1365 1594 17.95
## 5   NGC1425 1473 21.88
## 6   NGC2403  278  3.22
## 7   NGC2541  714 11.22
## 8   NGC2090  882 11.75
## 9   NGC3031   80  3.63
## 10  NGC3198  772 13.80
## 11  NGC3351  642 10.00
## 12  NGC3368  768 10.52
## 13  NGC3621  609  6.64
## 14  NGC4321 1433 15.21
## 15  NGC4414  619 17.70
## 16 NGC4496A 1424 14.86
## 17  NGC4548 1384 16.22
## 18  NGC4535 1444 15.78
## 19  NGC4536 1423 14.93
## 20  NGC4639 1403 21.98
## 21  NGC4725 1103 12.36
## 22   IC4182  318  4.49
## 23  NGC5253  232  3.15
## 24  NGC7331  999 14.72
##
## Call:
## lm(formula = y ~ x - 1, data = hubble)
##
## Residuals:
## Min 1Q Median 3Q Max
## -736.5 -132.5 -19.0 172.2 558.0
##
## Coefficients:
## Estimate Std. Error t value Pr(>|t|)
## x 76.581 3.965 19.32 1.03e-15 ***
## ---
## Signif. codes: 0 '***' 0.001 '**' 0.01 '*' 0.05 '.' 0.1 ' ' 1
##
## Residual standard error: 258.9 on 23 degrees of freedom
## Multiple R-squared: 0.9419, Adjusted R-squared: 0.9394
## F-statistic: 373.1 on 1 and 23 DF, p-value: 1.032e-15Hubble’s Law, also known as the Hubble-Lemaitre law, is the observation in physical cosmology that galaxies are moving away from Earth at speeds proportional to their distance. In other words, the farther they are the faster they are moving away from Earth. The velocity of the galaxies has been determined by their redshift, a shift of the light they emit toward the red end of the visible spectrum.
Hubble constant is most frequently quoted in (km/s)/Mpc, thus giving the speed in km/s of a galaxy 1 megaparsec (3.09 time 1019 km) away, and its value is about 70 (km/s)/Mpc. However, the SI unit of H0 is simply s-1, and the SI unit for the reciprocal of H0 is simply the second. The reciprocal of H0 is known as the Hubble time. The Hubble constant can also be interpreted as the relative rate of expansion. In this form H0 = 7%/Gyr, meaning that at the current rate of expansion it takes a billion years for an unbound structure to grow by 7%.
Plot the residuals against the fitted values
plot(fitted(hub.mod),residuals(hub.mod),xlab="fitted values",ylab="residuals")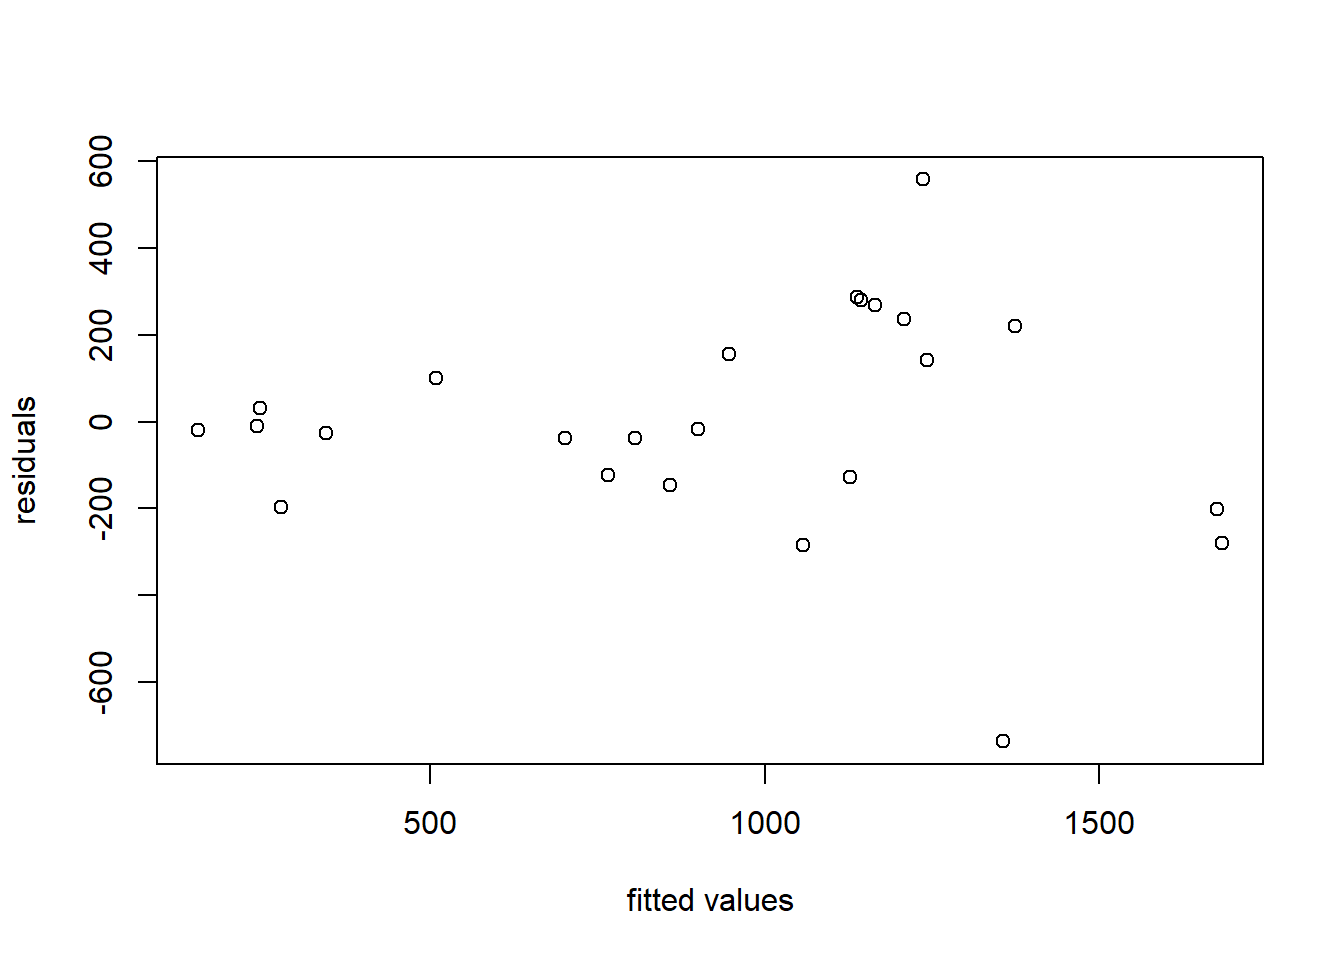
Omit offending points and produce new residual plot
hub.mod1 <- lm(y~x-1,data=hubble[-c(3,15),])
summary(hub.mod1)
##
## Call:
## lm(formula = y ~ x - 1, data = hubble[-c(3, 15), ])
##
## Residuals:
## Min 1Q Median 3Q Max
## -304.3 -141.9 -26.5 138.3 269.8
##
## Coefficients:
## Estimate Std. Error t value Pr(>|t|)
## x 77.67 2.97 26.15 <2e-16 ***
## ---
## Signif. codes: 0 '***' 0.001 '**' 0.01 '*' 0.05 '.' 0.1 ' ' 1
##
## Residual standard error: 180.5 on 21 degrees of freedom
## Multiple R-squared: 0.9702, Adjusted R-squared: 0.9688
## F-statistic: 683.8 on 1 and 21 DF, p-value: < 2.2e-16plot(fitted(hub.mod1),residuals(hub.mod1),xlab="fitted values",ylab="residuals")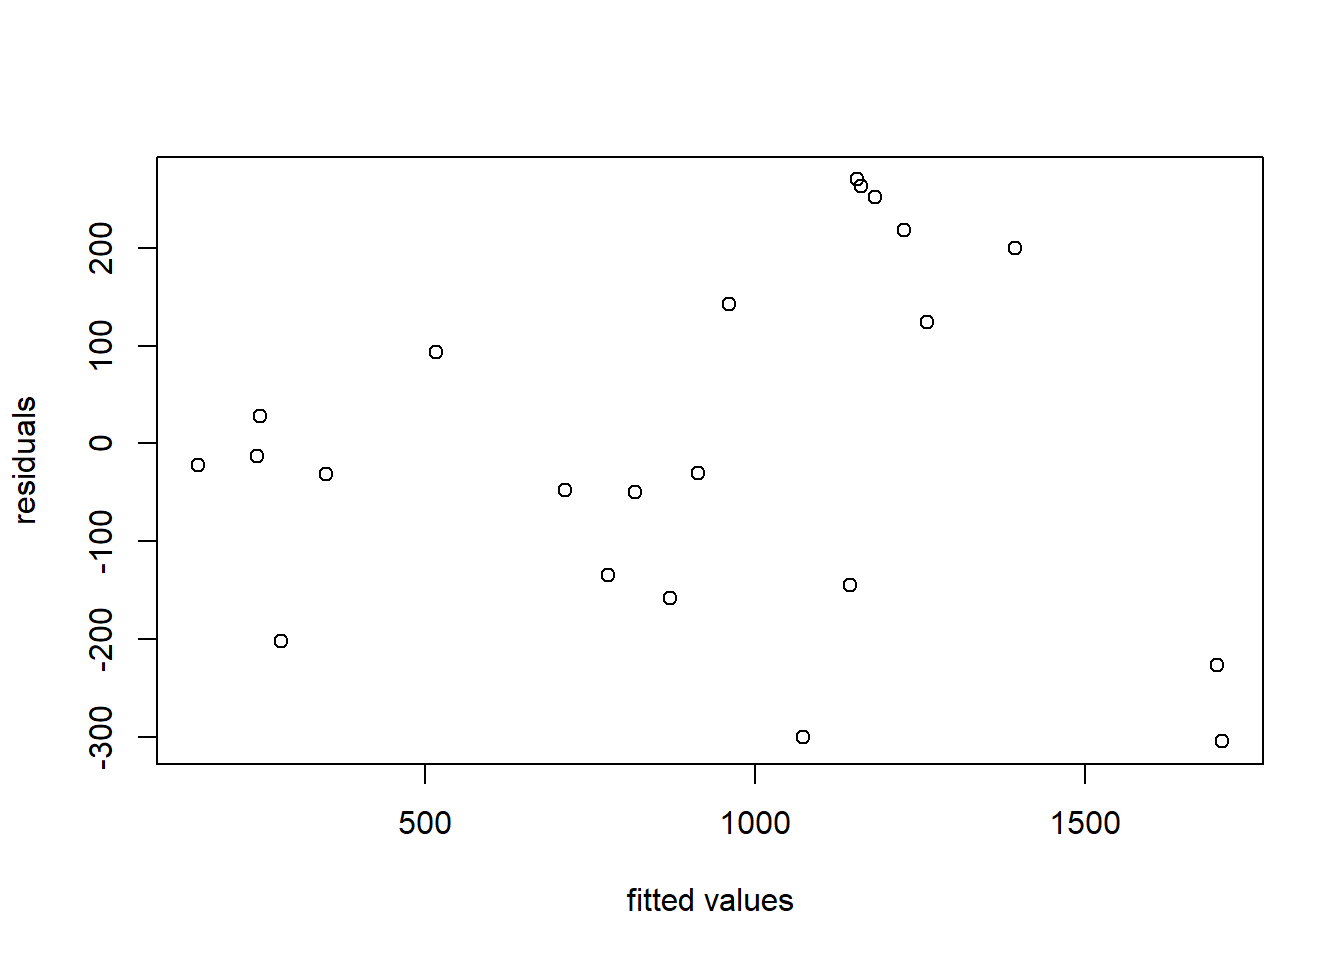
Estimate Hubble’s Constant
hubble.const <- c(coef(hub.mod),coef(hub.mod1))/3.09e19
age <- 1/hubble.const
age
## x x
## 4.034934e+17 3.978221e+17age/(60^2*24*365)## x x
## 12794692825 12614854757Testing Hypotheses about β in Creationist Theory
cs.hubble <- 163000000
t.stat<-(coef(hub.mod1)-cs.hubble)/summary(hub.mod1)$coefficients[2]
pt(t.stat,df=21)*2
## x
## 3.906388e-150Confidence intervals
sigb <- summary(hub.mod1)$coefficients[2]
h.ci<-coef(hub.mod1)+qt(c(0.025,0.975),df=21)*sigb
h.ci
## [1] 71.49588 83.84995h.ci<-h.ci*60^2*24*365.25/3.09e19 # convert to 1/years
sort(1/h.ci)## [1] 11677548698 13695361072Mean-value for
Relevant literature;
References
Edward Hillenaar
Writer - Data Scientist - Philosopher
My research interests include psychology, philosophy and data science of the origin and nature of human consciousness.