Prevalentie COVID-19 en positieve PCR-tests in Nederland
Inleiding
Geen enkele test geeft een 100% nauwkeurig resultaat. Tests moeten worden geëvalueerd om hun gevoeligheid en specificiteit te bepalen, idealiter door: vergelijking met een ‘gouden standaard.’ Het ontbreken van zo’n duidelijke “gouden standaard” voor covid-19-testen maakt het evalueren van de testnauwkeurigheid een uitdaging. Een systematische review van de nauwkeurigheid van covid-19-tests meldde fout-negatieve percentages tussen 2% en 29% (wat overeenkomt met een gevoeligheid van 71-98%), op basis van negatieve RT-PCR-tests die positief waren bij herhaalde tests.(Watson, Whiting, and Brush 2020a)
Stel dat u positief of negatief test op SARS-Cov-2, het coronavirus dat COVID-19 veroorzaakt. Hoe groot is de kans dat je de ziekte daadwerkelijk hebt? In dit artikel ga ik kijken naar de stelling van Bayes uit de wiskunde om ons te helpen de voorwaardelijke kansen te berekenen. COVID-19-tests vallen eigenlijk in twee categorieën, genetische tests en antilichaamtesten, en beide hebben verschillende niveaus van gevoeligheid en specificiteit, d.w.z. hoe nauwkeurig ze zijn. Terwijl genetische tests extreem lage fout-positieve percentages hebben, hebben sommige antilichaamtests hogere fout-positieve percentages en, gezien de lage prevalentie in de algemene bevolking, laat de stelling van Bayes zien hoe problematisch dit eigenlijk kan zijn. (Bazett 2020)
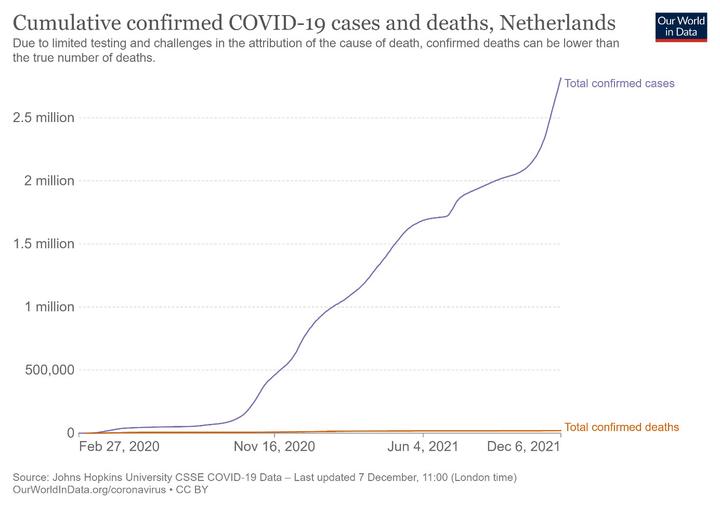
Aantal cumulatieve positieve PCR-tests op 5 december 2021 in Nederland:
Max. 2814521, zegge ruim 2.81 miljoen. Aantal inwoners Nederland in 2020 = 17,44 miljoen (2020).1
Dat betekent dat de prevalentie van positieve testen op SARS-CoV-2 is een simpel rekensommetje van 2814521 / 17440000 = 0.1613831, oftewel; 1,6 %.
Github repository voor COVID-19 data en analyses van Center for Systems Science and Engineering (CSSE) at Johns Hopkins University. (University, n.d.)
Methoden
Data definitie COVID-19 in Benelux en Duitsland
Data positieve PCR-tests in Nederland
datatable(Netherlands)summary(Netherlands$PCR_test_positief)## Min. 1st Qu. Median Mean 3rd Qu. Max.
## 1 58117 919712 953532 1710973 2814521Data positieve PCR-tests in Benelux inclusief Duitsland
datatable(Benelux)summary(Benelux$PCR_test_positief)## Min. 1st Qu. Median Mean 3rd Qu. Max.
## 1 53229 211666 903982 1287577 6219259Bayes’ Formule en voorwaardelijke kansen van besmetting met SARS-CoV-2
Comment on “Bayes’ Theorem in the 21st Century” by Bradley Efron (Amrhein, Roth, and Korner-Nievergelt 2013)
Suppose you test positive or negative for SARS-Cov-2, the coronavirus that causes COVID-19. What are the chances you actually have the disease? In this video we’re going to look at Bayes’ Theorem from mathematics to help us compute the conditional probabilities. COVID-19 tests are actually in two categories, genetic tests and antibody tests, and both of these have different levels of sensitivity and specificity - i.e how accurate they are. While Genetic tests have extremely low false positive rates, some antibody tests do have higher false positive rates and, given the low prevalence in the general population, Bayes’ theorem demonstrates how problematic this can actually be. Disclaimer: I’m not a medical doctor or epidemilogist, just a math prof, and so these toy examples are meant to illustrate the ideas of Bayes’ theorem, not make actual concrete predictions based on a specific test (Bazett 2020)
Covid and Statistics/Interpreting a covid 19 test result Jessica Watson bmj.m1808.full.pdf:pdf (Watson, Whiting, and Brush 2020b)
Resultaten
Prevalentie cijfers COVID-19 in Nederland
In figuur 1 is de evolutie van de prevalentiecijfers te lezen van positieve PCR-tests in Nederland vanaf 27 februari 2020 tot en met 6 december 2021.
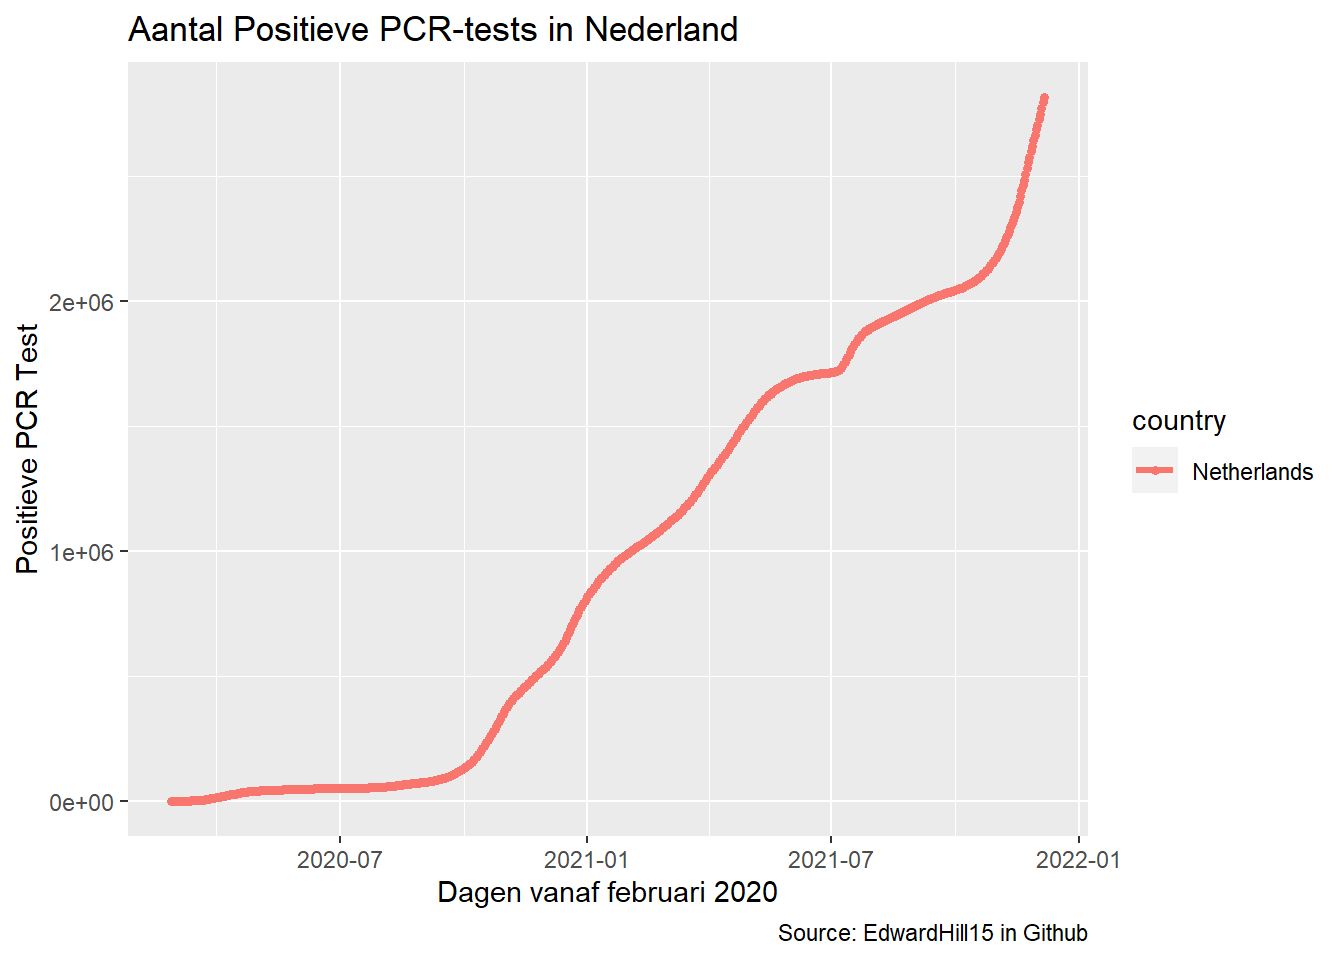
Figure 1: Dagen op de x-as vanaf 27 februari 2020 tot en met 6 december 2021 in Nederland.
Prevalentie cijfers COVID-19 in Benelux en Duitsland
In figuur 2 is de evolutie van de prevalentiecijfers te lezen van positieve PCR-tests in de Benelux, inclusief Duitsland vanaf 27 februari 2020 tot en met 6 december 2021.
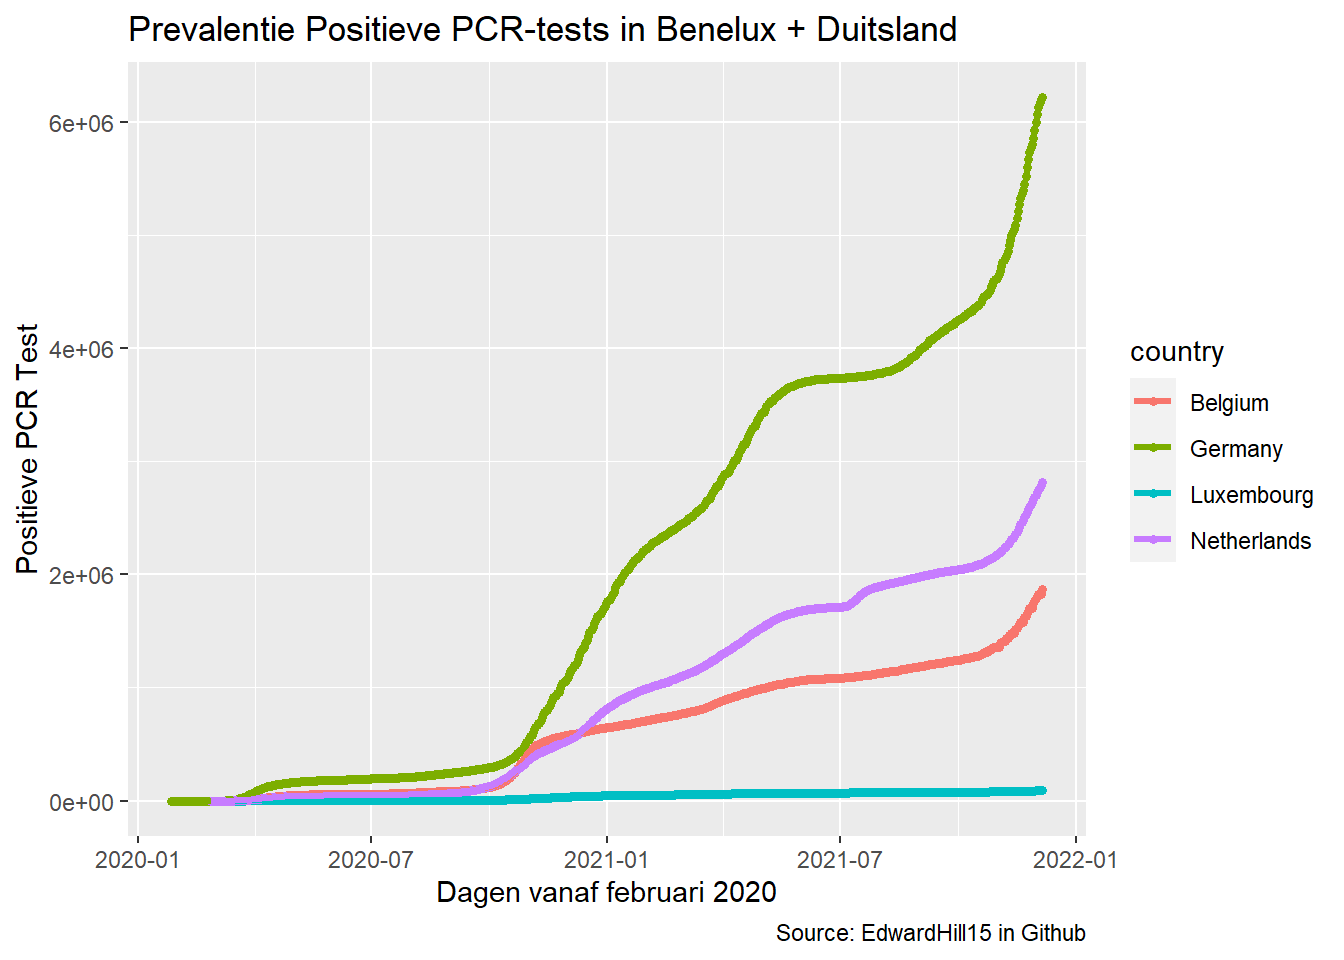
Figure 2: Dagen op de x-as vanaf 27 februari 2020 tot en met 6 december 2021 in Benelux en Duitsland.
Regressie Prevalentie positieve tests COVID-19 in Nederland
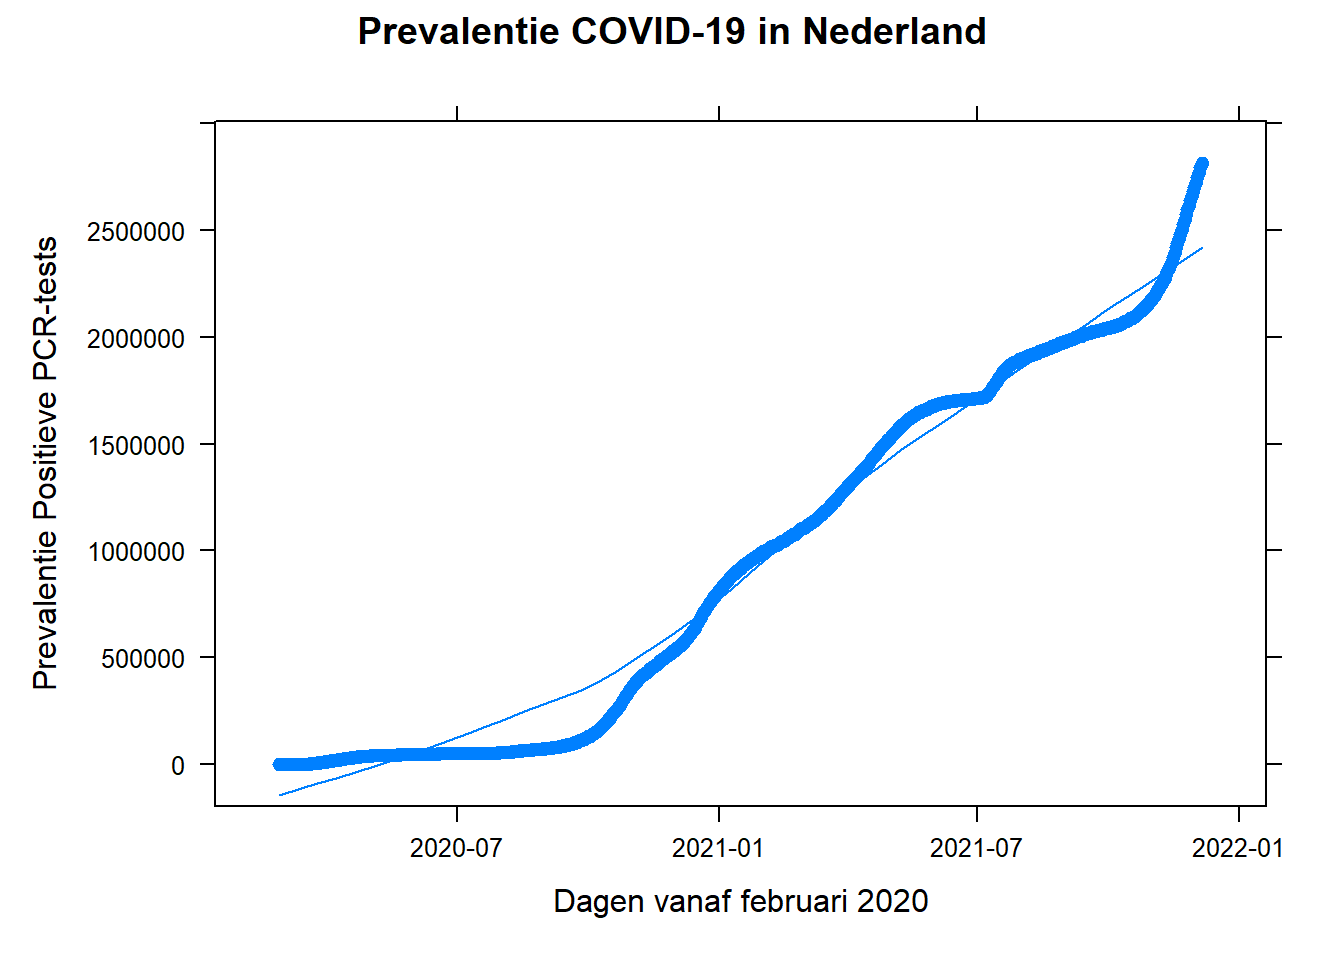
Figure 3: Loess line voor prevalentie COVID-19 in Nederland
Conclusie and Discussie
There is increasing concern that most current published research findings are false. The probability that a research claim is true may depend on study power and bias, the number of other studies on the same question, and, importantly, the ratio of true to no relationships among the relationships probed in each scientific field. Method: Simulations are performed to assess the likelihood that a published result is false. Results: In this framework, a research finding is less likely to be true when the studies conducted in a field are smaller; when effect sizes are smaller; when there is a greater number and lesser preselection of tested relationships; where there is greater flexibility in designs, definitions, outcomes, and analytical modes; when there is greater financial and other interest and prejudice; and when more teams are involved in a scientific field in chase of statistical significance. Discussion: For many current scientific fields, claimed research findings may often be simply accurate measures of the prevailing bias. Conclusion: In this essay, I discuss the implications of these problems for the conduct and interpretation of research (Ioannidis 2021)
Weinig fenomenen hadden op globaal niveau zo snel een diepgaande impact als de huidige corona-uitbraak. In een mum van tijd werd het menselijk leven totaal gereorganiseerd. Hoe dit kon, wat de consequenties ervan zijn en wat we verder kunnen verwachten vragen we aan Mattias Desmet, psychotherapeut en professor klinische psychologie aan de Gentse universiteit(Dewals 2021)
Referenties
“bron: google search”↩︎
Edward Hillenaar
Writer - Data Scientist - Philosopher
My research interests include psychology, philosophy and data science of the origin and nature of human consciousness.